Course
Machine Learning for Time Series Data in Python
4 hr
51.9K
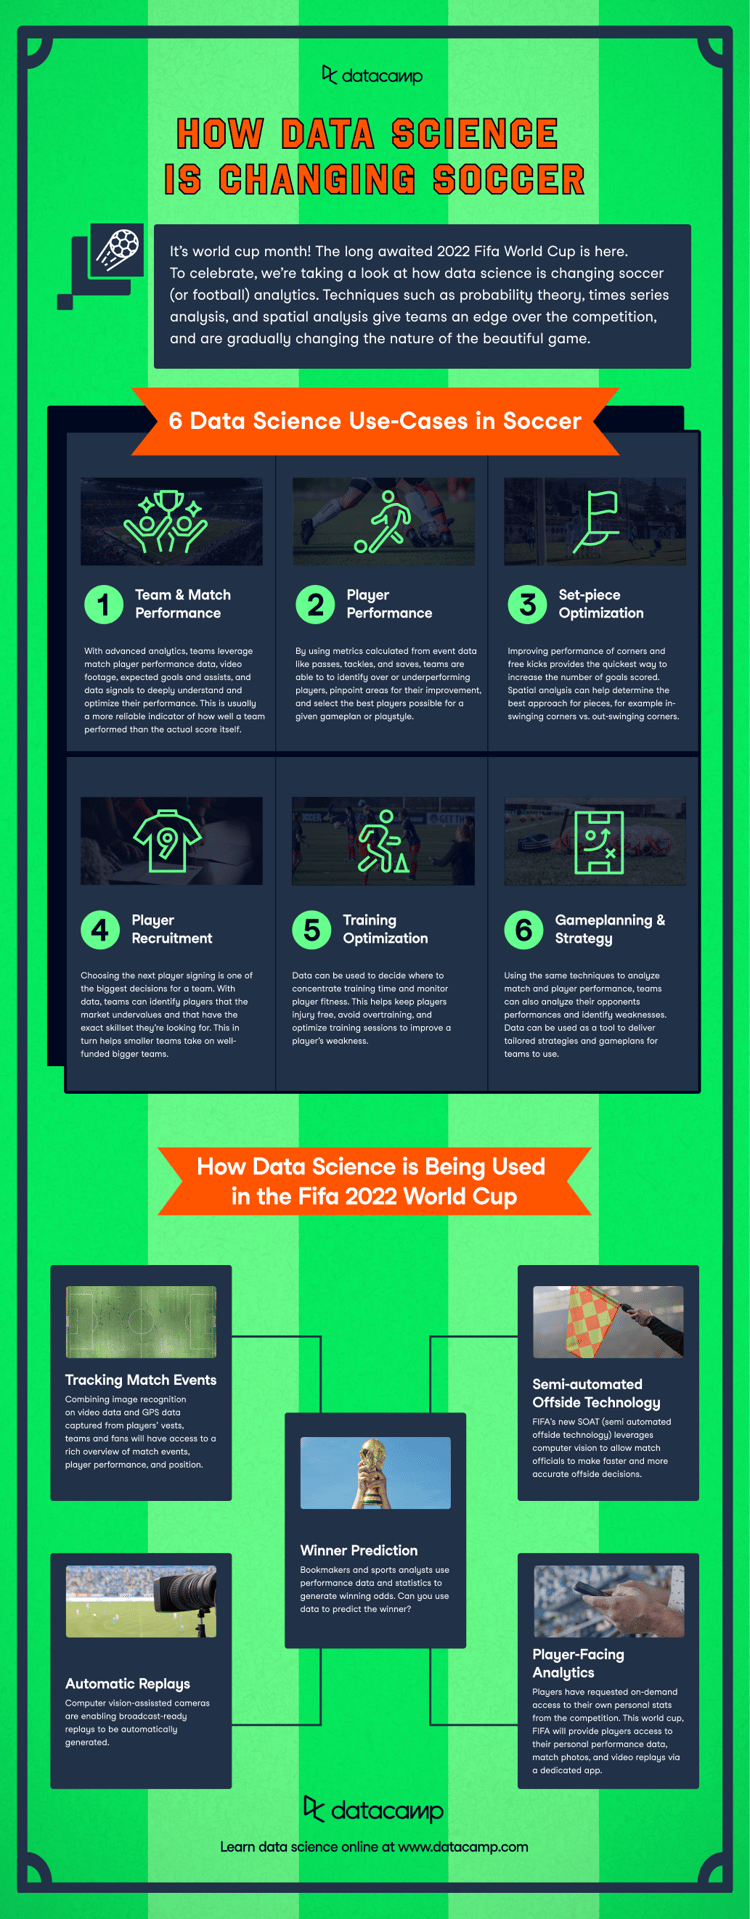
When I was 14, I made my first football bet on the FIFA World Cup 2010 winner. Relying on intuition alone, I guessed each match and bet on the two finalists of my tournament plan: the Netherlands and Spain. In the end, those two teams made it to the final—I was thrilled that my predictions had come true.
Fast forward 14 years, I sought a project to deepen my Python and machine learning skills, which led me to a prediction project for EURO 2024. My main objective was to predict match results (win, draw, or loss) and the number of goals scored by each team.
In this article, I offer an overview of my EURO 2024 prediction project, highlighting the key steps I took, the challenges I encountered, and the insights I gained. For a deeper dive into the technical details, including code implementation, please refer to the accompanying notebook project—you’ll need a DataLab account to access all the files.
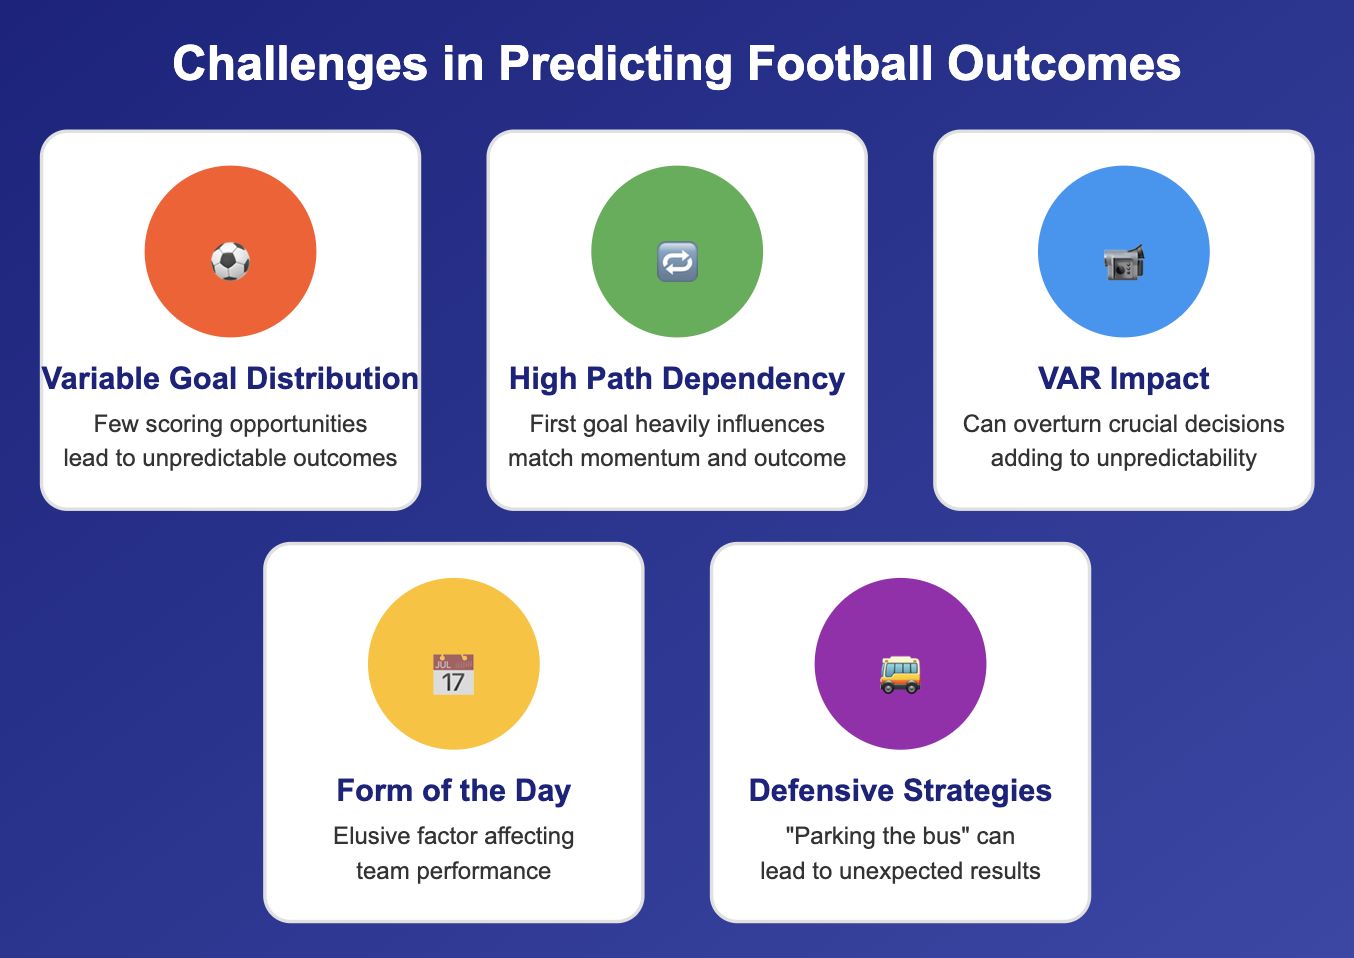
Predicting football outcomes is notoriously challenging due to several factors. In football, the statistical distribution of goals is quite variable. At the same time, there are relatively few scoring opportunities per match compared to other team ball sports, leading to unpredictable outcomes.
Take handball, for example: its frequent scoring chances tend to produce more predictable results because the number of goals is more likely to reflect the creation and prevention of chances as the number of scoring attempts averages out over the course of the game. In football, however, it can sometimes be enough to “park the bus” in front of your goal and play one determined counterattack to turn the match upside down.
Additionally, football matches are characterized by high path dependency, meaning the momentum and outcome of the match usually heavily depend on the first goal. Small but significant actions can lead to a goal or red card and dramatically change a match's course, making predictions even more difficult.
The introduction of VAR (Video Assistant Referee) in recent years has added to the unpredictability, as it can overturn crucial decisions on the field. And let's not forget the elusive "form of the day," a factor I could write a book about as a fan of the notoriously unpredictable Eintracht Frankfurt (aptly nicknamed the "moody diva").
Besides the factors discussed, my prediction model also faces several additional data limitations I must address.
To address challenges with the data used, several strategies were used:
I filled in missing data points where possible to ensure the dataset remained comprehensive—for example, adding tactical formations for the matches to be predicted.
As most teams stick to the same formation, once they trained and tested it, I assumed that each team will play in the formation they used most often in the last five matches. This allows us to predict matches before the line-up becomes public, which only happens one hour before the match starts.
When neither imputation nor removal was practical, I excluded or replaced certain features to avoid compromising the model's accuracy.
Originally, for example, I wanted to do a two-level prediction that takes the primary features to predict secondary features like ball possession and expected goals, to predict the outcome based on those secondary features, too. For the sake of simplicity, I decided against this procedure, and instead assigned each team two features based on match average statistics to represent their playstyle.
Where imputation wasn't feasible, I removed the missing data to maintain dataset integrity. Fortunately, there was only a small loss of observations, so the dataset still contained over 3,000 matches for model building.
Having addressed the difficulties and limitations, let’s examine the process of turning raw data into insightful predictions. The data pipeline, the project's backbone, involved collecting, preprocessing, and preparing the data for modeling, leveraging various tactical, psychological, and historical features.
The initial step involved scraping historical match data from various sources, including Transfermarkt, to gather comprehensive information about past matches.
One row in the resulting DataFrame corresponds to one match from the perspective of one of the teams involved. This data was combined with FootyStats data to include playstyle features like average ball possession and efficiency metrics.
For more details, check out the data scraping notebook here.
Following up, raw data was transformed into meaningful features that could be used by the machine learning models. This involved extracting values, transforming variables, and calculating averages.
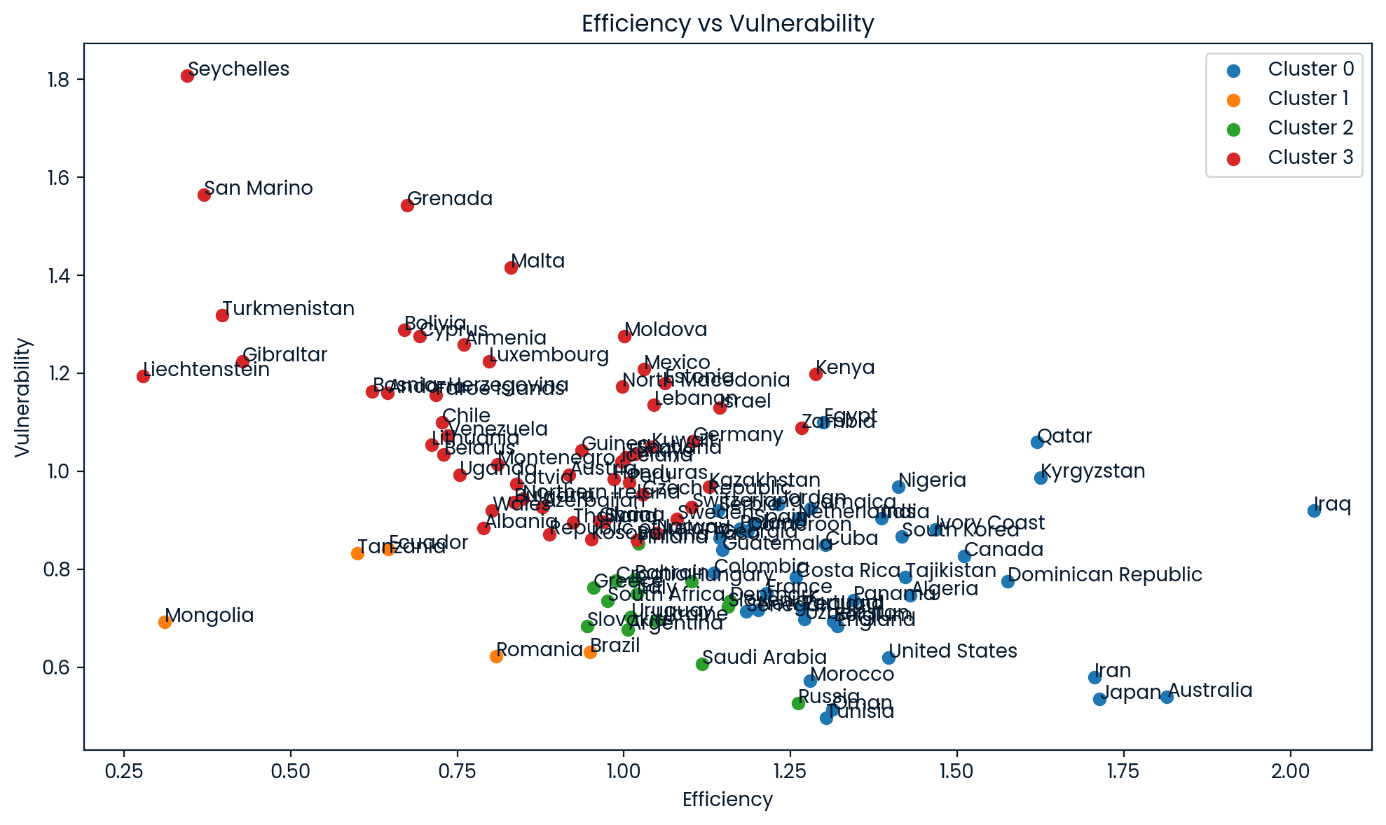
Clusters of efficiency versus vulnerability of all teams in the dataset
Several key features were identified and used in the models to enhance the accuracy of predictions. These features included:
Before building the machine learning models the dataset is split up into unplayed and played matches to distinguish between labeled and unlabeled data. Furthermore, we take the logarithm of the highly right-skewed form features and apply normalization and one-hot encoding to ensure the data is in a suitable format.
The team variables including the long-term trend have to be scaled using MinMaxScaler to prevent the zeroes representing matches without the respective team from influencing its scale. All other numerical features are normalized using StandardScaler.
To identify the most effective models for predicting football outcomes, I began with a broad selection of machine learning models. Adopting a "black box" approach, I explored various models to understand their strengths and weaknesses in handling the data. For each model, I used the classification version to predict match outcomes and the regression version to predict the number of goals scored by both teams. The models I tested included:
I first set a seed (my former shirt number, nine) for reproducibility. Defining labels and targets and model building involved several key steps, which all included comparing model performances using cross-validation:
Ultimately, I selected the best-performing models based on their precision in predicting match outcomes (win/loss) and Root Mean Squared Error (RMSE) in predicting the number of goals.
I chose two models for match outcomes: one for predicting wins and losses, and another specifically for draws. This distinction was necessary because the patterns and factors influencing draws differ significantly from those affecting wins and losses. To ensure the final probabilities for all three outcomes (win, draw, loss) add up to 100%, the model application results were later normalized.
Using the chosen models with their selected hyperparameters and features, I predict all labels for every row. Since there are two rows for every match to be predicted, we get two probabilities for every match outcome and two float numbers as predicted goals for each team.
These values should not differ too much from each other, and in most cases, they do not—if they do, however, we flag the match to signify the prediction must be considered with some grain of salt. To reduce them to one value for each label only, I take the average of both predicted values.
For match outcomes, I normalized the probabilities of win, draw, and loss to ensure they summed to 100%. I also created additional columns to capture popular betting options like "double chance." Based on the float number of predicted goals per team, I instantiate a Poisson distribution and derive probabilities for each number of goals for each team and for whether the sum of all match goals is over or under 1.5, 2.5, 3.5, 4.5, and 5.5, which are quite popular to bet on.
For my tipping predictions, I chose the outcome with the highest probability. If the winning probabilities for both teams were within 0.05 of each other, I interpreted this as a draw. For goal predictions, I selected the most likely number of goals for each team, adjusting the numbers as needed to ensure they aligned with the predicted outcome.
To predict future EURO matches, I updated the raw match data with the initial predicted outcomes. By incorporating these predictions into the dataset and re-applying feature engineering, I could then predict the next round of matches based on the evolving tournament landscape.
Understanding the difference between accuracy and precision is crucial in the context of football predictions, particularly when considering the application of these predictions. Using betting versus tipping as an example can illustrate the importance of these metrics:
The goal is to find bets where the expected return is positive. This means that you need to identify likely outcomes and consider the odds bookmakers offer to find value bets.
Precision is crucial here, as it focuses on the correctness of positive predictions (e.g., predicting a win). High precision helps in consistently identifying undervalued bets by bookmakers, directly affecting profitability.
Please keep in mind that betting companies have whole teams to build and maintain very sophisticated predictive models that will likely beat a simpler one like mine in most cases.
The objective is to guess the result of each match accurately. Participants earn points for each correct prediction, with the goal of accumulating the most points over a series of matches. Overall accuracy is more important in this scenario because it measures how often your predictions are correct, impacting your total score.
The prediction of draws is another perfect example of the possible discrepancy between the two measurements. Only about 20% of the matches in the training data ended in a draw, leading most models to underestimate the chance of a draw and sometimes even never predict one.
This leads to a high accuracy rate of about 80% since all the non-draws are labeled correctly, but a precision of 0 for draws because none of the draws was predicted as such.
The performance of the models varied based on the type of prediction:
Since different models are used, there are cases in which outcome and goal predictions do not match. Although it’s hard to compare categorical and numerical scores, I think it is fair to say that outcome predictions generally work better than those for goals, which is why the latter gets adjusted to the former in case of a mismatch.
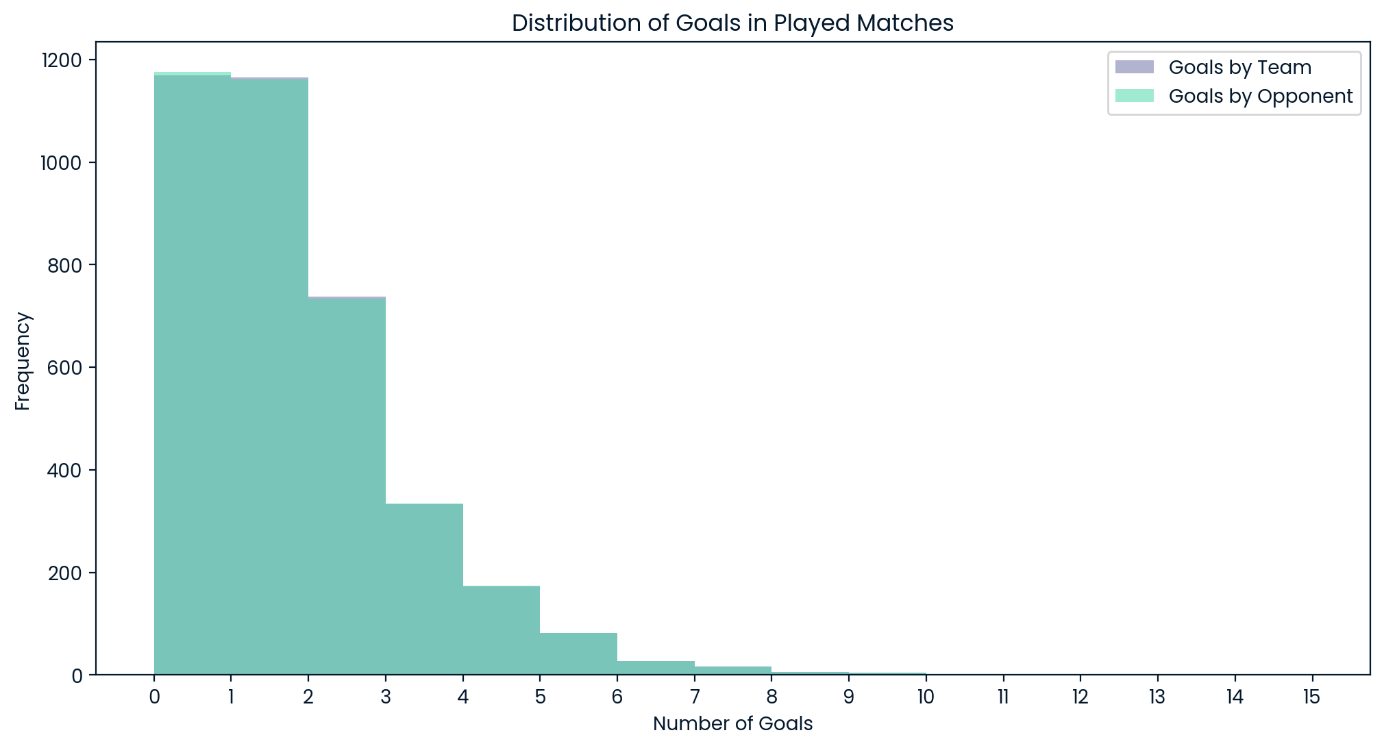
Distribution of Goals in All Played Matches
It is notable that the model exclusively resorts to scores of zero, one, and two as the most likely goal number for any team in any match. Given the overall goal distribution in the testing data, this comes as no surprise, but it must be kept in mind that the model will never expect a match with many goals as the likely result.
Applying the models to the first EURO matches generated interesting results!
In three-quarters of cases, the model predicted the winner to be the favored team, while for the remaining quarter, the predicted outcome did not reflect the bookmakers’ favorites.
At first glance, this ratio seemed like a good bet, as it’s fair to assume that there are a certain number of surprising results. But now it gets to the tricky part, which is a general question in football predictions, regardless of whether you use your gut or a machine learning model: When does it make sense to bet on the underdog?
One strategy to deal with this is to only and always bet on the favorite. This means you will get a share of surprises wrong, but overall, your accuracy will be quite good. Trying to guess the unexpected results, too, is the only chance to optimize the accuracy of your bets, but it is obviously the more difficult and risky strategy.
Assuming the ratio of surprises is roughly constant, every mistake counts double—for every guessed surprise that did not come true, you are missing one by betting on the favorite.
I chose the riskier approach, but it has not reaped big benefits so far. My model was quite unlucky regarding possible surprises, leading to a rather disappointing accuracy of 50% for the first matchday.
For instance, the model predicted that Serbia and Georgia, the two underdogs, would draw against England and, respectively, win against Turkey. However, the favorites won in both cases. On the other hand, the model did not predict actual surprises like Slovakia's victory against Belgium, Romania's stunning 3:0 win against Ukraine, and Denmark's draw with Slovenia.
The following predictions were made after the second matchday, with one group match left for each team. The most surprising result is the one for the most interesting group, even in group E, where all teams share the same number of points (3) with one match to go.
Using the model, Slovakia is predicted to win the group after a 1:0 victory over Romania since they won against Belgium. Thus, Slovakia would relegate the big group favorite to second place. The model even forecasts Slovakia to be the tournament’s biggest surprise, predicting them to win against Austria and proceed into the quarterfinals.
The prediction for the entire tournament course was particularly challenging due to the format, where the best third-placed teams also qualify for the knockout stage. This introduced various possible matchups, adding further complexity depending on which groups the four best third-placed teams originate. So, take the following predictions with a grain of salt—the matchups might change completely, even if one team’s goal difference changes by only one goal.
The K.O. matches are generally predicted to be very tight, with a Spanish 2:0 victory in their possible 1/8 final match against Romania as the only one with an expected goal difference larger than one.
The Italian matches push the closeness to the extreme, with draws being the predicted outcomes for their first two K.O. matches. As penalty shootouts are rare and there isn’t sufficient data to predict their winners, I resorted to my memories of the good Italian penalty track record and expected Italy to win both penalty shootouts against Switzerland and England.
In the end, the model predicts Spain, Portugal, the Netherlands, and Italy to reach the semi-finals.
The Netherlands and Spain make up my predicted final, just like in 2010—might it be that history repeats itself?
This project provided several key learnings:
To improve the predictions and expand the project's scope, several steps can be taken:
For more detailed information and code, please visit the project notebook.
This blog post offers an overview of the challenges and methodologies involved in predicting football outcomes, highlighting the journey and learnings from the EURO 2024 prediction project.
Integrating data science and sports analytics provides exciting opportunities for enthusiasts and professionals in the field. As the project continues to evolve, the goal remains to refine the models and expand their application to other tournaments, contributing to the growing field of sports analytics.
If you want to learn more about sports analytics, here are some resources you can try:
Learn machine learning with these courses!
Course
Course
Course
blog
Arne Warnke
7 min
blog
Richie Cotton
3 min
blog
Kurtis Pykes
13 min
Tutorial
Daniel Poston
code-along
Thomas Schmidt
code-along
Iason Prassides