
Course
Introduction to Tableau
6 hr
306.1K
As with other business intelligence tools or software, the beautiful visualizations on Tableau's surface, such as this waterfall chart, are made possible by robust and integrated processes behind the scenes. The way these processes are structured is what we mean by Tableau’s architecture and serves as the subject of this comprehensive guide.
Understanding Tableau's architecture is an essential part of the job for server administrators and data architects. However, data analysts also benefit from a better understanding of Tableau's architecture. For one thing, they will better understand the tool's capabilities and limitations. Additionally, understanding the architectural components will allow them to better identify the sources of errors and interpret what they mean.
Tableau offers over 10 distinct products and counting. These products can be divided into two main categories. The first category includes products focused on development, including Tableau Server, while the second category consists of products geared towards publishing, including Tableau Desktop.
Some of these products have similar user interfaces and intersecting functionalities, yet each has its own architecture. While they are all integrated into one family, some are created to work more closely with each other than others. Tableau Desktop and Tableau Server are a prime example: What you create on Tableau Desktop is passed to Tableau Server, where it can be published, stored, managed, and shared for collaboration.
As a data practitioner developing reports, Tableau Desktop is likely to be the face of Tableau that you are most familiar with. It is the starting point that installs on your computer, and where you connect to data sources and create visualizations.
Tableau Desktop architecture is relatively simple. It has three main components or layers.
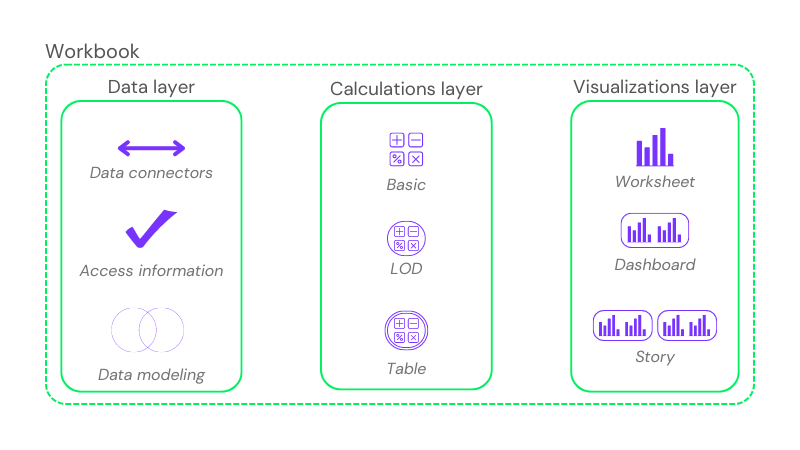 Tableau Desktop architecture
Let’s take a look at each of these layers in more detail.
The data layer is where your data arrives at Tableau Desktop and gets ready to be analyzed and visualized. How it works depends on how you choose to connect to your data, as there are two connection types:
Whatever connection type you choose, Tableau Desktop offers 90 data connectors to access your data from wherever it is stored, whether in flat files, SQL servers, or cloud document management platforms.
The data layer also stores data access information, such as location and authorization credentials, and provides data modeling capabilities, such as aggregating and joining tables or changing data types.
Tableau has a powerful calculations engine that lets you create custom fields to do the analysis required for your visualizations, whether to do an aggregation, segmentation, filtering, data type conversion, or something else.
It offers three main types of calculations:
The visualizations layer is where you create, customize, and format your visualizations. In other words, this is where all the fun happens. This layer offers Tableau’s three hierarchical structures for creating your visuals.
The three layers of Tableau Desktop – data, calculations, and visualizations layers – together form a Tableau workbook. You can locally save the whole workbook as a Tableau packaged workbook (.twbx) file and share it with other team members to view and collaborate.
Keep in mind that, if you simply passed a Tableau workbook file to a colleague, they would have to have Tableau Desktop installed on their end to view the file. Moreover, you will have no management or governance capabilities over the file. For this reason, publishing your workbook on Tableau Server is a more efficient way to collaborate with Tableau projects. On this note, let’s now explore Tableau Server Architecture.
Tableau Server itself is a group of processes that form a full analytic platform. It allows reports and data sources to be published, managed, governed, secured, explored, and edited. It can be deployed on-premises or in a cloud of your choice. Your organization would be responsible for its full management and security.
The architecture of Tableau Server includes at least 18 components and subcomponents, but the exact number is subject to change as Tableau Server undergoes frequent development changes. For the scope of this article, we will expand on the main components that are involved in the process of publishing a workbook or accessing a view. Specifically, we will explain eight of its components.
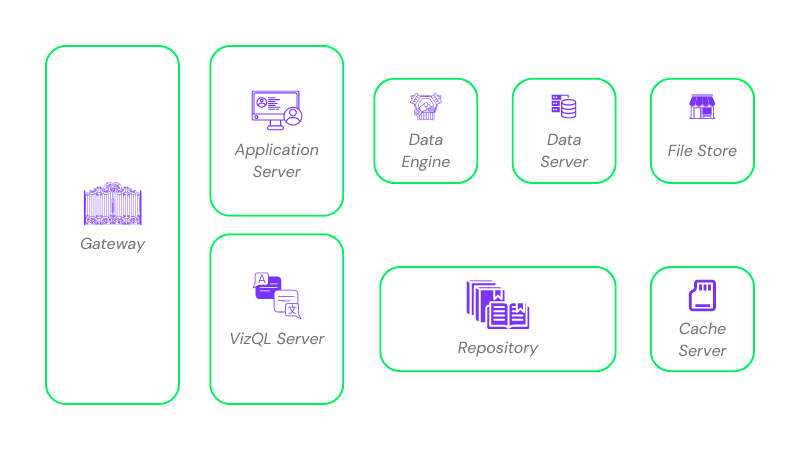 Tableau Server architecture
The gateway is like the front desk receptionist of Tableau Server. When a client approaches Tableau Server with a request, Tableau directs the request to the relevant components to get the job done. The client here can refer to a user of Tableau Desktop who wants to publish their report or a viewer who wants to log in and access a report.
Later in the process, the gateway handles giving back the appropriate response to the client, whether it is a requested view, query, or simply a message that says the publishing has been done successfully.
The application server is like the gateway's sidekick. It takes the request from the gateway and processes it to ensure that the request is ready to go in the direction that the gateway pointed to.
For instance, if a user wants to publish a workbook, the application server decomposes it into two files: an XML file that stores all information about the visuals in the workbook and passes it to be stored in the repository and a file invented by Tableau called Hyper, which contains the source data to be stored in the file store.
When a viewer wants to access the server, the application server first checks if the user is registered and their level of access by reviewing the user logs in the repository. After confirming this information, it prepares the appropriate user interface for that specific user.
The VizQL server is a cool and unique component of Tableau Server, and it was also invented by a couple of Tableau founders. The name stands for Visual Query Language, and it acts as a translator between the SQL language of databases and the visual language of visualizations.
For example, when a client interacts with a view, the VizQL server queries the data source via the data engine and data server. It also retrieves the necessary metadata from the repository. Once the data and metadata are matched, the VizQL server sends the visual to the gateway, which then delivers it to the user.
The repository is the central hub for storing and managing metadata related to Tableau Server. The data stored here includes the published workbooks XML files and the user logs, with user accounts, roles, and permissions. It also stores data about the usage of the assets on the server, like the number of views and most used data sources.
The data sources used in the workbooks are the only type of data not stored in the repository. This type of data is stored in the file store, which we will discuss next.
The file store controls the storage of the extracted data sources in Tableau Server. In certain environments, it can also make and manage copies of the extracts to make sure the source data is available to query in case of any technical faults.
This is a database engine designed specifically for handling extracted data sources stored in Tableau Server's file store. The data engine transforms and optimizes these extracted data sources using Hyper for efficient storage in the file store.
The data engine also acts as the interface for querying the file store for any purpose, including viewing, updating, and refreshing the data extracts or views based on them.
If a user wants to access a view with extracted data sources, the data server sends a query to a component called the data engine, which in turn queries the data source from the file store, where the copy of the data resides.
Meanwhile, if the view has live data sources, the data server would call data connectors to query the data from its external source.
As its name suggests, the cache server stores an in-memory cache for previously viewed views and queries to speed up future results by serving cached results.
When deploying Tableau in your organization, the first thing to know is that Tableau Server is not your only option to publish and collaborate on Tableau views and data assets. The option to consider is Tableau Cloud.
While Tableau Server needs to be fully managed and secured by your organization, Tableau Cloud is a platform with similar user interface and functionality that would be fully hosted, managed, and secured by Tableau itself.
Therefore, if your organization does not have specific security and IT infrastructure needs, or the required human and tech capabilities to manage a server by itself, Tableau Cloud would be a better option. Otherwise, roll up your sleeves and go ahead with Tableau Server.
From an IT perspective, Tableau has a Blueprint document and an Enterprise Architecture Survey with a full list of considerations that organizations must take before deploying Tableau. But along with involving IT, here are a few general considerations that you may need to think about from a governance perspective.
In this article, we explored the architecture of the most commonly used Tableau products, Tableau Desktop and Tableau Server. We also discussed considerations when deploying Tableau on an organizational level.
If you want to understand more about Tableau Server, try playing with this interactive dashboard from Tableau. You can also watch this presentation from the Tableau team.
Finally, if you are getting started with Tableau, we have an Introduction to Tableau course and a whole track for Tableau Fundamentals. If you have more experience, do not hesitate to try the Data Analyst in Tableau track, which prepares you for the Tableau Certified Data Analyst certification.
Learn Tableau with DataCamp
Course
Course
Course
blog
Wendy Gittleson
15 min
blog
Alex Blackman
4 min
blog
Kenneth Leung
6 min
Tutorial
Eugenia Anello
Tutorial
Abid Ali Awan
Tutorial
Parul Pandey