Course
Introduction to Power BI
4 hr
711.7K
Power BI, a leader in business intelligence, has evolved to empower users to not only visualize their data but to interact with it in more intuitive ways. The latest exciting addition is Power BI Copilot, which is integrated seamlessly into the Power BI suite.
Copilot harnesses the power of artificial intelligence to transform how businesses engage with data analytics. In this tutorial, we will explain Power BI Copilot in detail so you can understand how it can streamline your data analysis workflow.
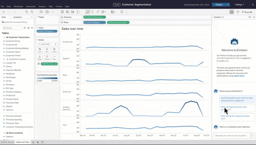
 Power BI Copilot. Source: 2WTECH
For those unfamiliar with Power BI, it is a popular business analytics service from Microsoft. Power BI extracts and transforms data and provides beautiful visualizations to aid organizations in making better business decisions. DataCamp offers many courses for beginners who want to learn, such as Introduction to Power BI.
The newest addition, Power BI Copilot, enhances the functionality of Power BI using generative AI. Data professionals can now uncover, extract, and analyze data faster by simply asking questions or making requests in plain language.
In other words, with Power BI Copilot, Power BI users have a generative AI coding assistant that is present with their data, understands their business context, and provides support in these areas:
Simply put, while other coding assistants only help with code generation, Power BI Copilot transforms your data into a compelling data narrative so your organization can make better data-driven business decisions.
Let’s explore how Power BI Copilot works in terms of architecture and user experience. Understanding how Power BI Copilot works will help us phrase our prompts for the most accurate and effective insights.
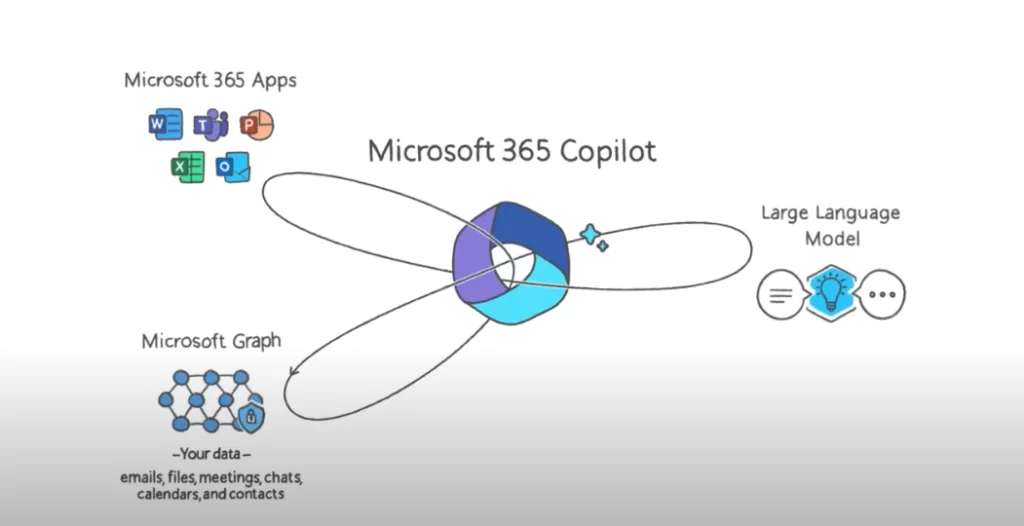 How Power BI Copilot accesses data from various sources. Source: Microsoft
Like other language models, Power BI Copilot uses natural language processing (NLP) techniques to understand the context and meaning behind text data.
More specifically, Power BI Copilot works because it has been trained on large datasets, and when faced with new data, it converts words to numbers where it can then analyze sequences and relationships. Specifically, it uses the following machine learning techniques.
After understanding the data context, Power BI Copilot uses its semantic and data modeling capabilities to find relationships and patterns in your data. It then provides targeted recommendations and suggestions based on natural language prompts from the user.
The machine learning behind Power BI is pretty amazing stuff. Let's now take a look at the result of these algorithms in the user experience.
Power BI Copilot suggestions appear in clear visuals so you can understand data more easily. You can refine these suggestions within the Power BI Desktop interface and provide feedback, which then helps improve Copilot over time.
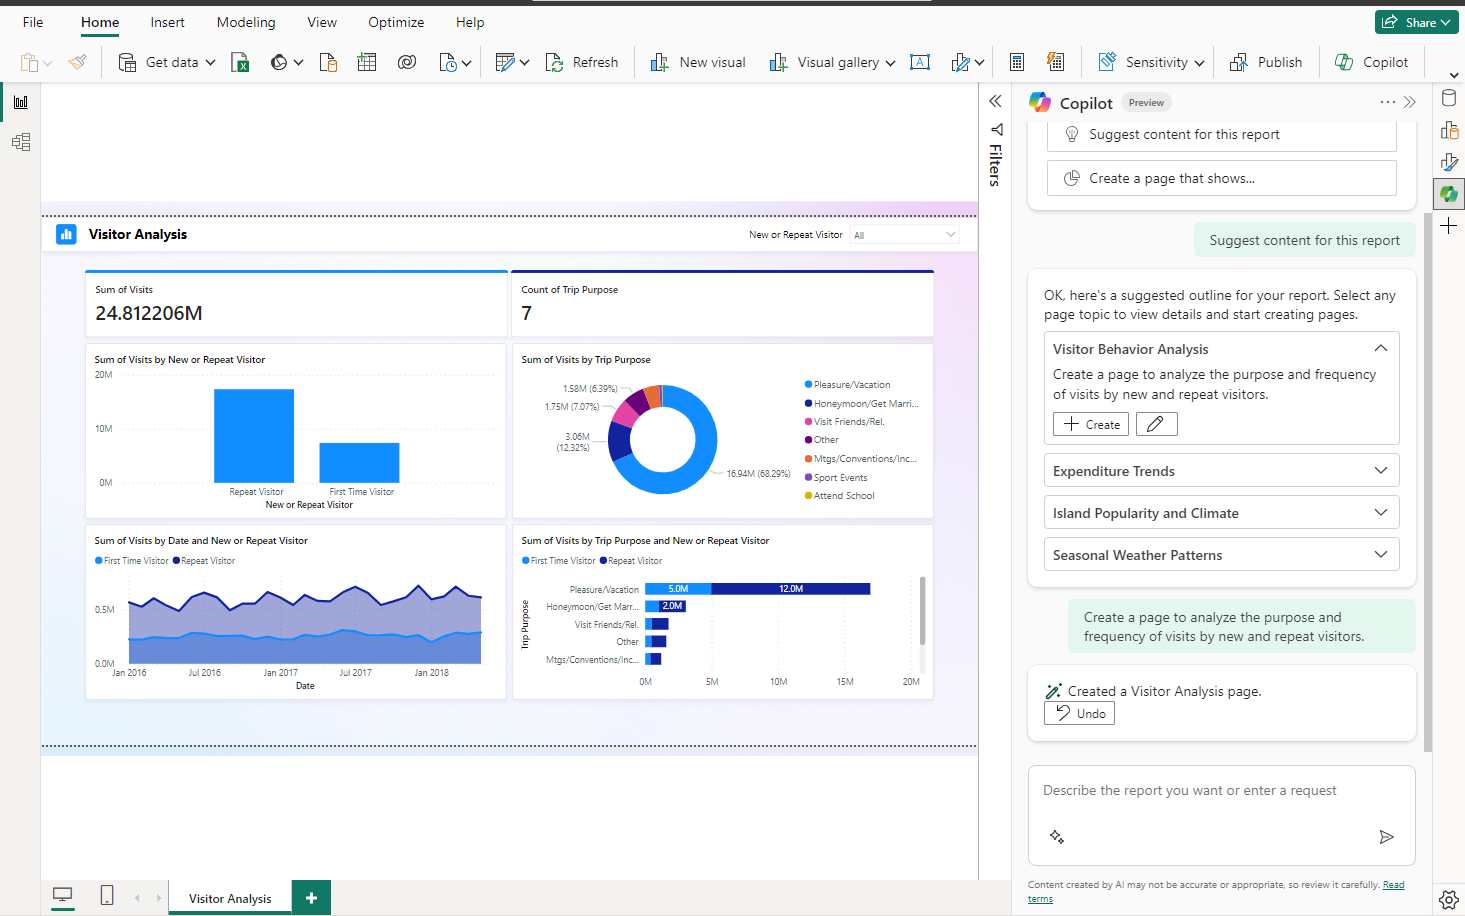
Let’s illustrate with an example: One could ask Power BI Copilot: "Create a page to analyze the sales amount, revenue, and profit margin of different products, categories, and subcategories over time and across regions." As a result of this prompt, it can give a full product analysis, including the sales performance of different products, and provide this information in a custom-built dashboard. Take a look:
 Power BI Copilot’s dashboard after a user-generated prompt. Source: Microsoft
You can see how Power BI Copliot’s easy-to-use interface makes it seamless to interact with it using natural language. You can ask questions about the data and receive insightful feedback.
Overall, it’s a quicker, more natural, and interactive way of exploring and analyzing data accurately and effectively. And it’s handy for data analysts and business intelligence professionals who are tight on deadlines and might be overloaded with work.
Let’s now examine Power BI’s most desirable features and use cases. Common use cases include semantic modeling, report creation, narrative generation, and more. As you will see, Power BI Copilot can be leveraged during all parts of the data analysis lifecycle.
Semantic modeling refers to structuring data in a way that becomes meaningful and easily understandable. This involves defining clear relationships between different data elements, organizing data hierarchies, and creating measures and calculated columns that express business logic. For example, in order to see how customers might place orders for different products, we have to have keys to join those relationships.
DAX, which stands for Data Analysis Expressions, creates custom calculations on the data stored in a data model. It's similar to Excel formulas but has been enhanced to work with relational data and perform dynamic aggregation. Amazingly, Power BI Copilot can write these DAX queries for you, including highly customized calculations for report pages.
One of the most striking features of Power BI Copilot is its ability to create report pages that include nice-looking charts and graphs. Power BI Copilot leverages generative AI to identify key trends, relationships, and patterns in creating reports. By automating report creation, analysts save a huge amount of time compared to manually building reports through the user interface.
 A report page in Power BI Copilot. Source: Microsoft
An equally compelling but lesser-known use case of Power BI Copilot is its narrative generation. Not only can analysts use Power BI Copilot to automate report creation, Power BI Copilot can also generate a narrative summarizing the data insights. Power BI Copilot presents the insights in a natural language format, making your reports easier to understand for even non-technical audiences.
You can easily create a summary of any report page in the Copilot pane. This will help you quickly understand your reports. Even if you don’t have permission to edit your organization’s reports, you can still understand the report without editing or changing the original Power BI report.
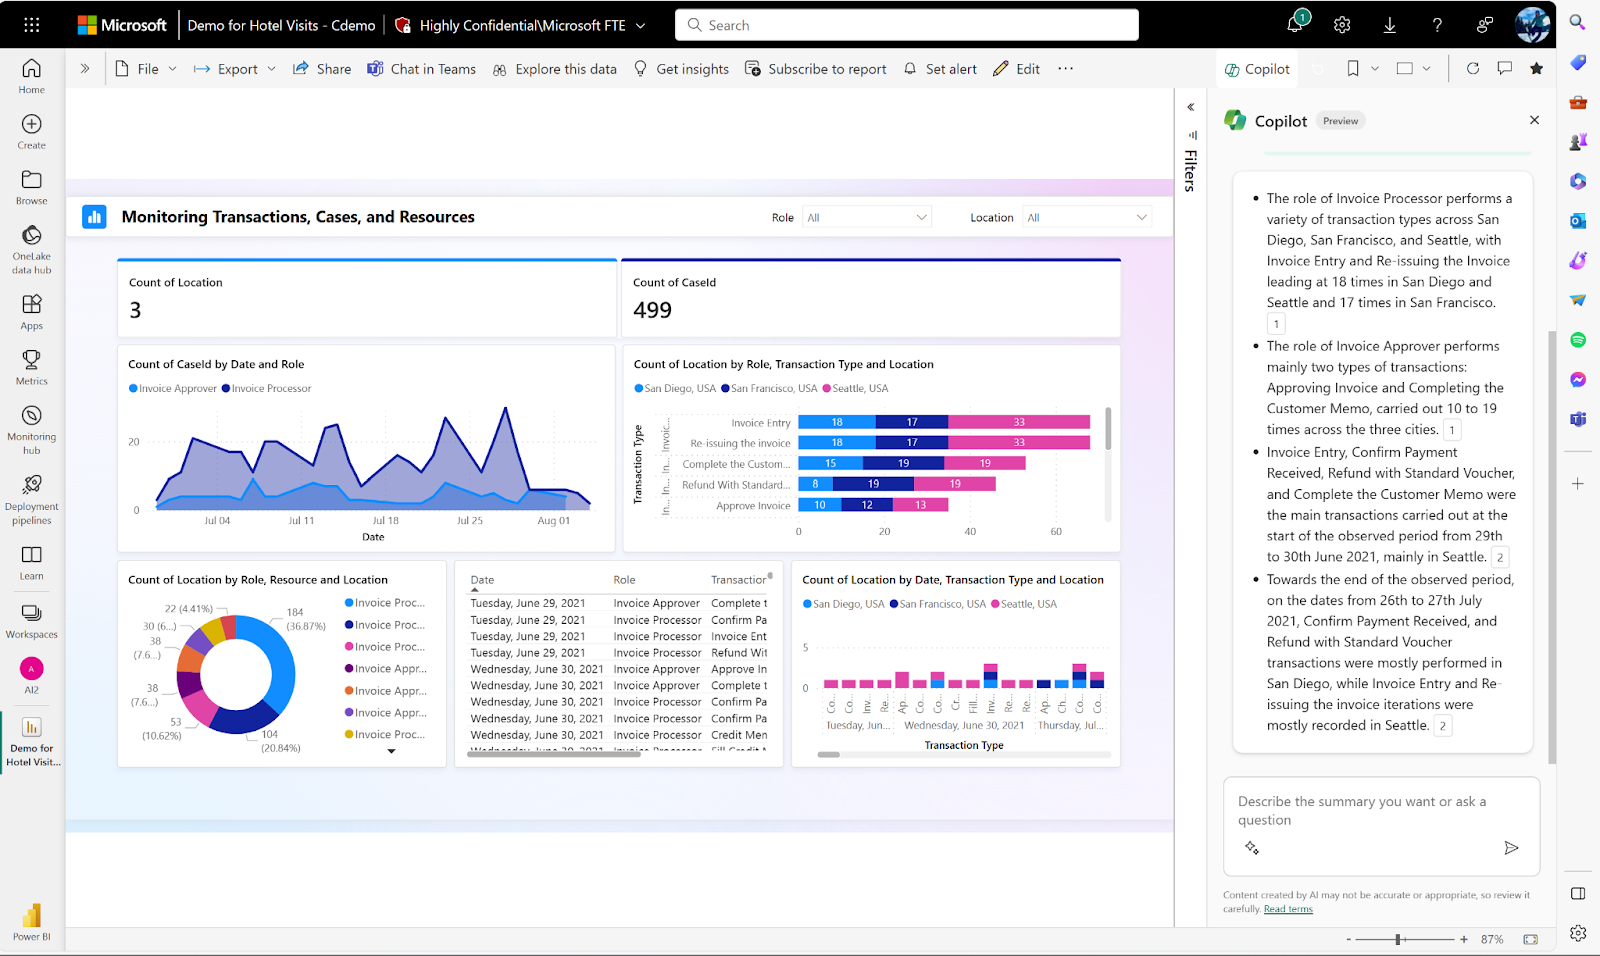 Report Summarization in Power BI Copilot Pane. Source: Microsoft
The Copilot also allows you to automatically generate a written summary or narrative about the data visualizations and insights in your Power BI report. This summary is displayed as a visual element right within the report itself.
Instead of manually writing an explanation for each chart, graph, or table in your report, the Copilot can analyze the data and create a plain-language narrative that summarizes and explains the key takeaways.
When working with Power BI reports, you can ask natural language questions about the data, and it will understand the intent behind the question to provide relevant insights. However, how you phrase your questions may sometimes not match the terminology used in the data model itself.
So, by providing synonyms, the Copilot can understand a wider range of user questions.
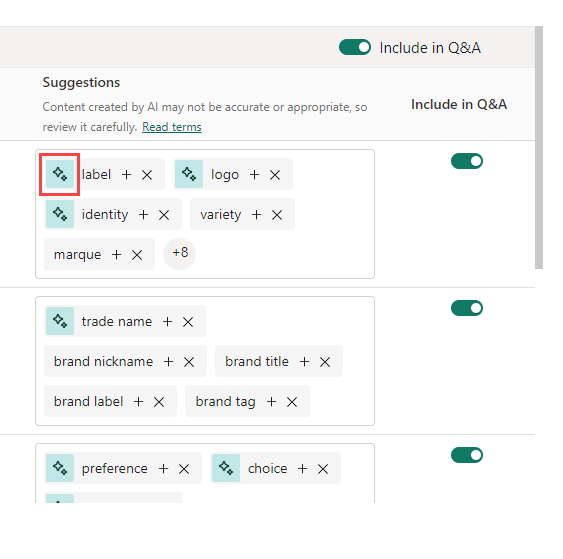 Setting up the Q&A visual in Power BI. Source: Microsoft
Power BI Copilot leverages the power of AI to analyze your data and give you different content recommendations. These content recommendations can include:
Power BI Copilot can surprise by making suggestions for improvement - things the user never even thought to ask about.
Your organization can only begin using Copilot in Power BI if you enable Copilot in Microsoft Fabric. Microsoft Fabric is a software-as-a-service platform (SaaS) that combines components of Power BI and other Microsoft services in a unified environment. Fabric is accessed by purchasing a Microsoft Azure subscription.
Here is a step-by-step guide on how to enable Power BI Copilot with Microsoft Fabric. The instructions are a bit different depending on whether or not Azure is available in your region.
Here are the steps if Azure is available:
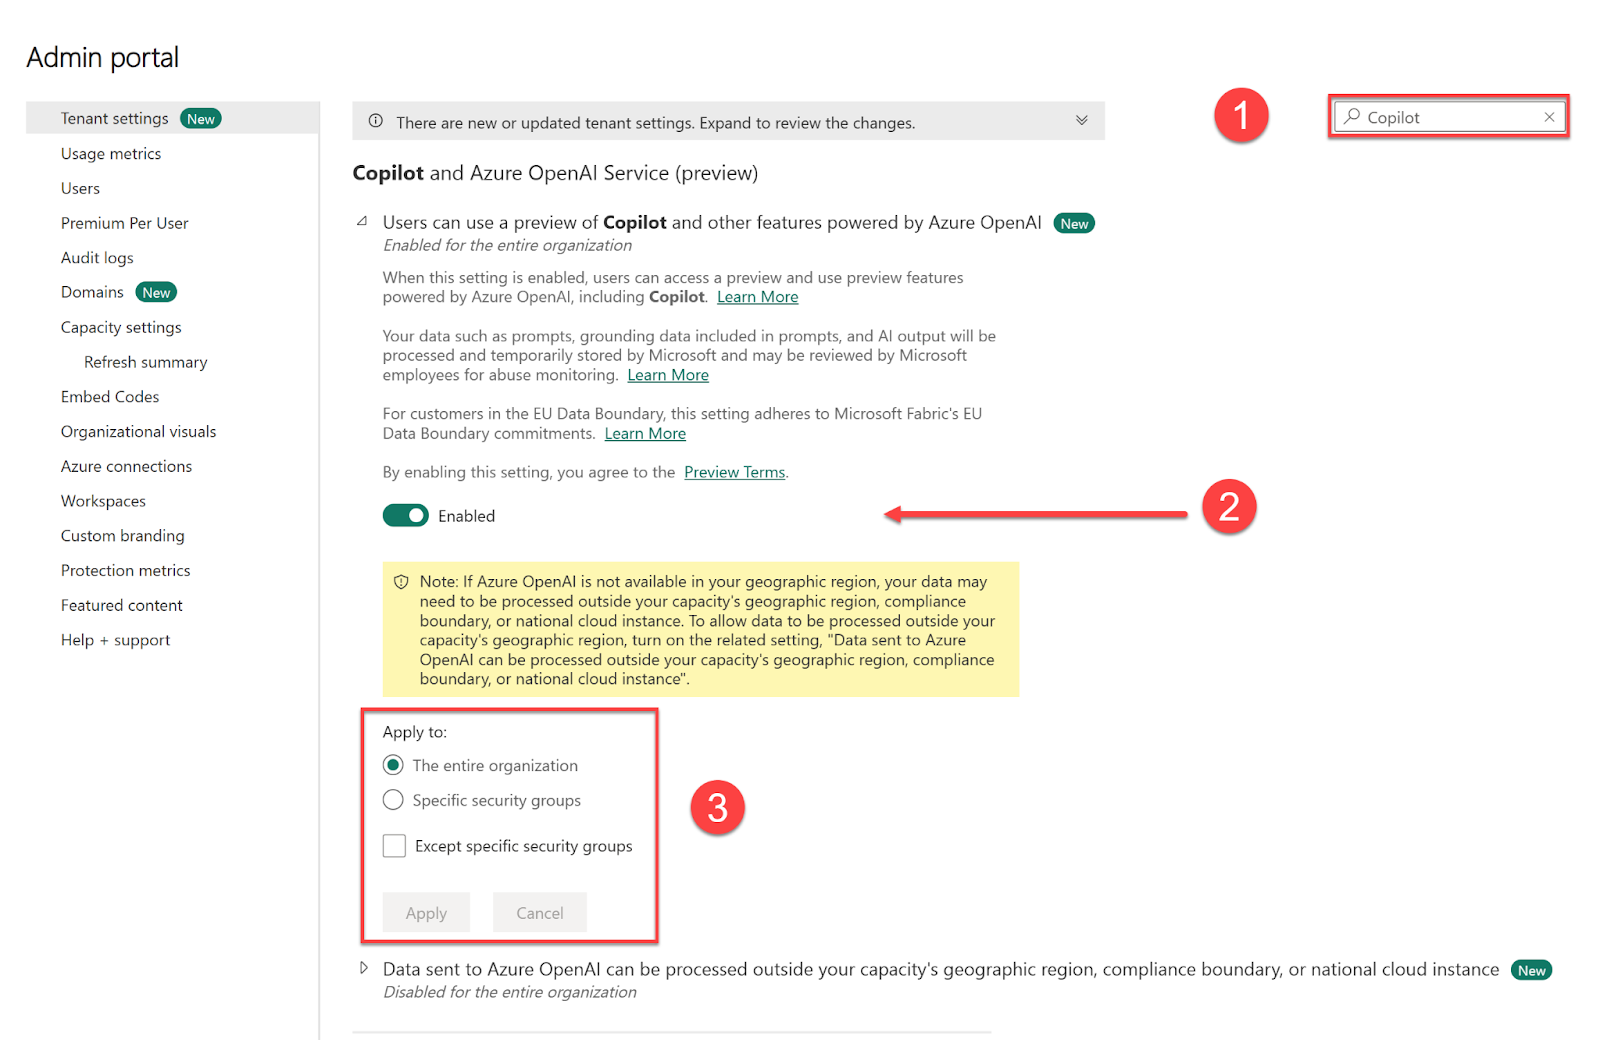 Enabling Power BI Copilot with Microsoft Fabric. Source: Microsoft
Switching on the button enables Copilot for all applications and services it can integrate with, not just Power BI. The final four steps inside the Admin Portal are quick.
In addition to the above-mentioned steps, you have to perform two extra steps to enable Power BI Copilot with MS Fabric if Azure isn’t available in your region:
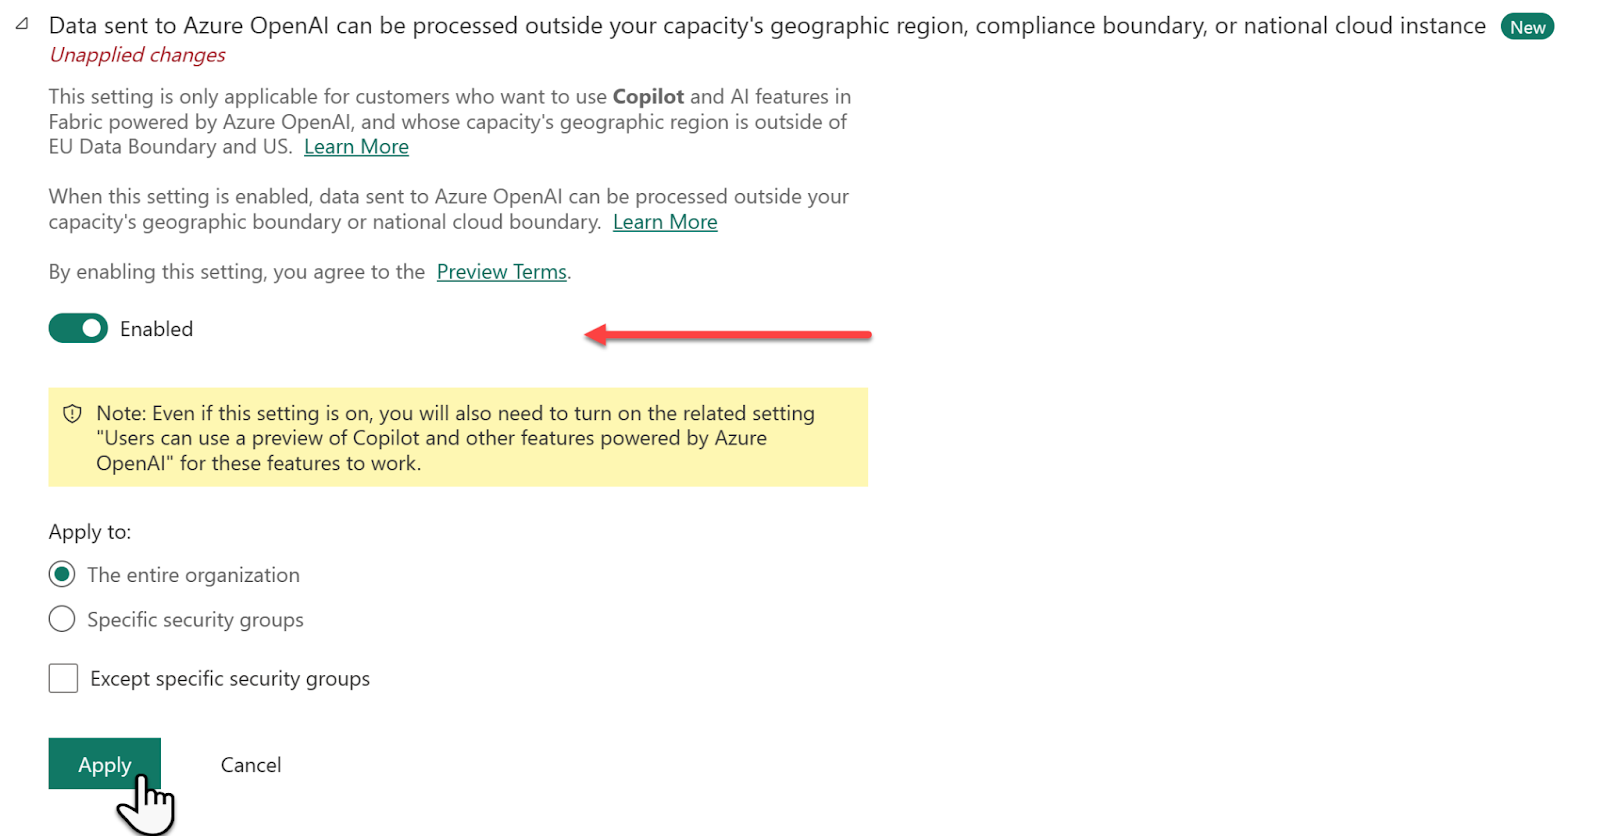 Enabling Power BI Copilot with Microsoft Fabric when Azure isn’t available in your region. Source: Microsoft
The cost of using Fabric Copilot in Power BI depends on the number of prompts you send and the responses you receive. These interactions are measured using tokens, which can be words, spaces, or punctuation marks. Input tokens include the text you type into the Copilot chat and metadata from your tables. Output tokens cover code, Power BI reports, and text responses generated by Copilot.
Luckily, Power BI will cache the input tokens for 2 days. When you re-run the same prompt on the same data, you get a faster response and aren’t even charged.
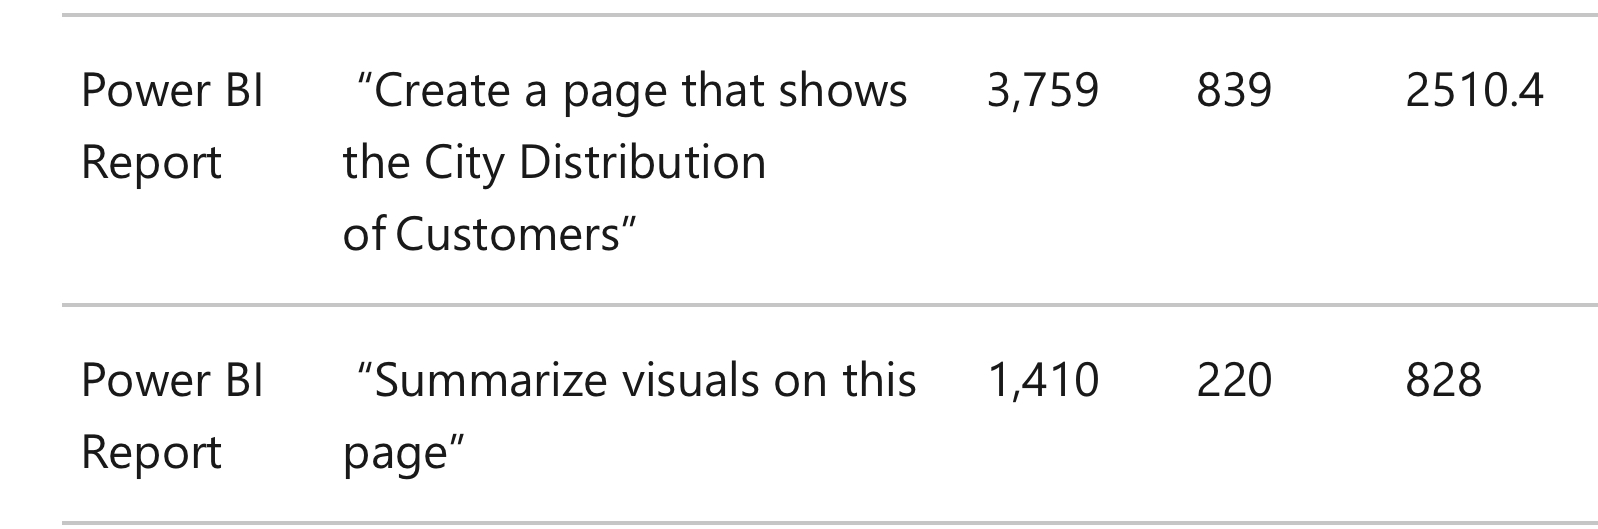 Calculating capacity consumption cost (CU seconds) of Power BI Copilot interactions. Source: Microsoft
Here we will review a few best practices and helpful keyboard shortcuts to get the most out of Power BI Copilot’s features and functionality.
Here are a few heuristics:
And here are some general keyboard shortcuts for Power BI that can streamline your workflow.
| Technique | Description |
|---|---|
| Resize a visual | Use arrow keys |
| Group visuals | Select visuals + Ctrl + G |
| Show or hide tooltip | Ctrl + H |
| Selecting or unselecting a data point | Enter or spacebar |
| Move a visual on the canvas | Use arrow keys (up, down, right, left) |
| Canvas zoom-in | Ctrl + Plus |
| Canvas zoom-out | Ctrl + Minus |
| Move around the canvas | Use arrow keys (up, down, right, left) |
| Interact with a slicer | Use the up arrow key and down arrow key to move focus between menu items |
| Select multiple contiguous items from the slicers | Shift + Up arrow key/Down arrow key, then Shift + F10 to open the context menu |
Power BI Copilot is a revolutionary tool in the realm of business intelligence, seamlessly integrating AI to enhance data analysis. For those aiming to elevate their skills, it's crucial to Learn Power BI. Additionally, Understanding Large Language Models for Business and enrolling in a Large Language Models Concepts Course will deepen your knowledge of the advanced capabilities offered by Power BI Copilot.
Implementing AI Solutions in Business has become more straightforward with the introduction of Power BI Copilot. This tool aids in generating reports, suggesting metrics, and crafting narratives, making it an invaluable resource for data analysts and business intelligence professionals. By mastering Power BI Copilot, users can significantly boost their productivity and derive more insightful, data-driven decisions.
Master the world's most popular business intelligence tool.
Learn Power BI with DataCamp
Course
Course
Course
blog
Kurtis Pykes
10 min
Tutorial
Eugenia Anello
Tutorial
Eugenia Anello
Tutorial
DataCamp Team
code-along
Shannon Lindsay
code-along
Nuno Rocha