Course
Intermediate Google Sheets
4 hr
56.3K
Spreadsheets are used by millions of people every day. They are an easy tool to use that can collect data, make calculations, and create visualizations. There are many types of spreadsheet platforms that you can check out here. For this tutorial though, you will learn the basics about Microsoft Excel and Google Sheets. A great course to take if you are new to spreadsheets is Spreadsheet Basics from DataCamp. With that said, let’s get started with spreadsheets and particularly Excel.
For Excel, you do need to pay for it and a link to do that is here. You will then need to download Excel to use it. Microsoft does offer a free trial to use.
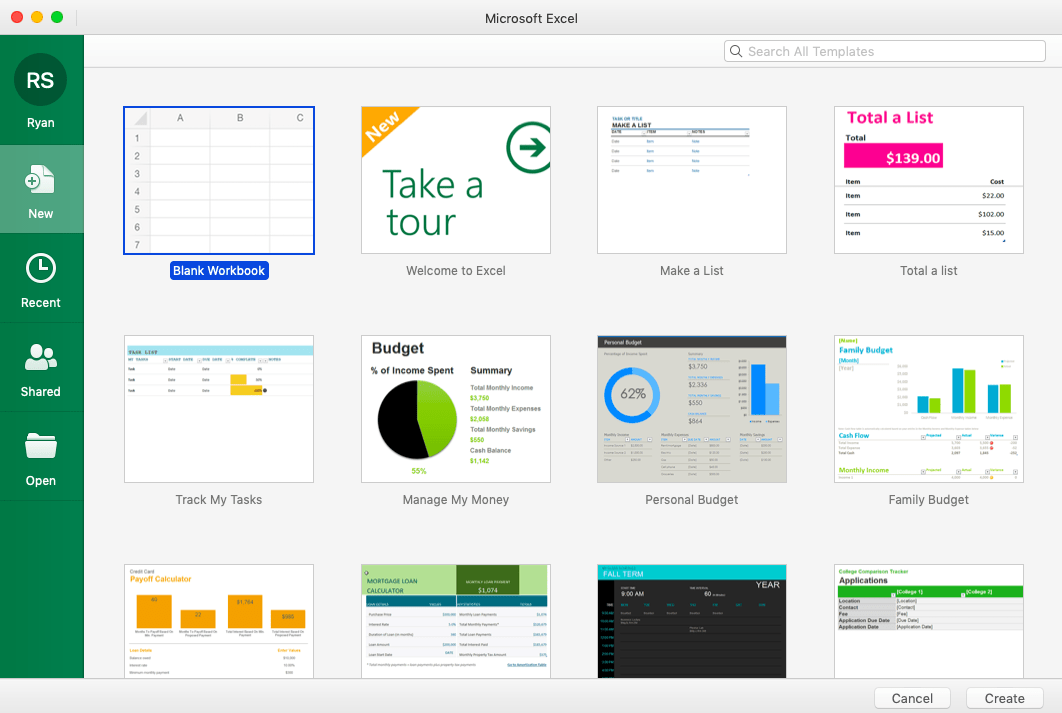
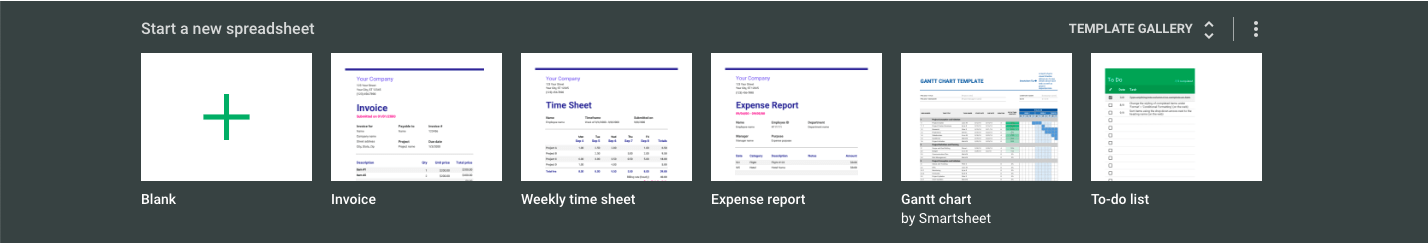
Once you have Excel on your computer, you will be prompted to the page below. Here you can select that you want to create a new blank spreadsheet, choose from a recent one you were working on, select a spreadsheet that is shared with you, or open a past spreadsheet that you either downloaded or haven’t opened recently. For this tutorial, we will select “New” and then “Blank Workbook”.
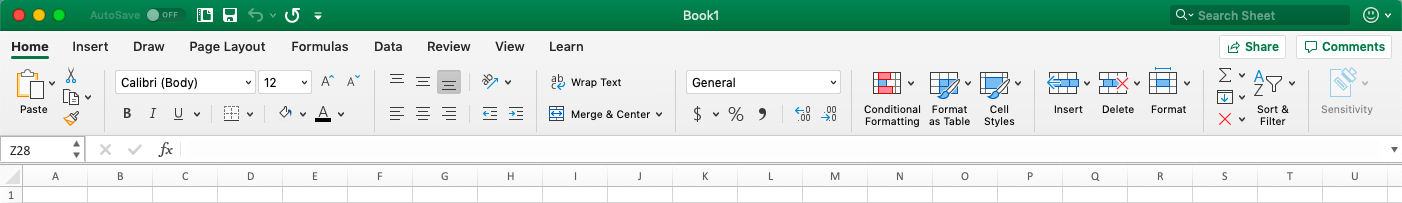
A big thing with spreadsheets is learning the terminology, and it is pretty consistent with both Excel and Google Sheets.
So for the page, you are looking at when creating a “Blank Workbook” is called a sheet. To add a sheet to your workbook click on the + sign next to sheet1. This will create a new sheet for you. You can also name sheets by double-clicking on the sheet title.
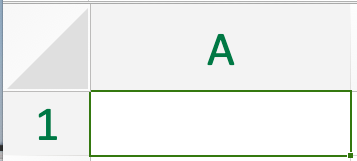
A column is classified vertically and located at the top of the sheet. They are identified by using letters. It is important to understand what these are called and how they are identified when writing formulas.
A row is classified horizontally and located on the right side of the sheet. They are identified by using numbers. Similarly to columns, it is important to understand what these are called and how they are identified when writing formulas.
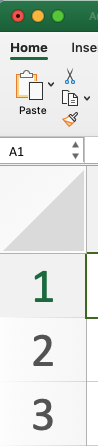
A cell is the box where you can type in the sheet. You can type both letters and numbers in cells. To identify a cell, you use the column letter with the row number. An example would be B7. This means the cell is 2 columns over and 7 rows down.
Below are gifs that show how to create a chart in Excel. The following things are covered:
This is useful for table titles, and it keeps things clean without having so many cell lines.

Excel has all the capabilities a word document does when formatting the text. You can bold, italicize, or underline. Highlight
Here we wrap the text, so our table does in grow in width. This is especially useful when you have many columns, and you want to see all or most of them on the screen.

Finally, to keep fields and cells separated and distinct from one another, you can add borders. There are many options so you can try different ones until you find what you are looking for.
Lastly, you can save the workbook by clicking file... Save or Save As... By clicking on Save AS... you will be able to change the title of the workbook and select the location of where it is being saved. Finally, you can choose the file type you want to save the workbook as, e.g., .csv or .xlsx.
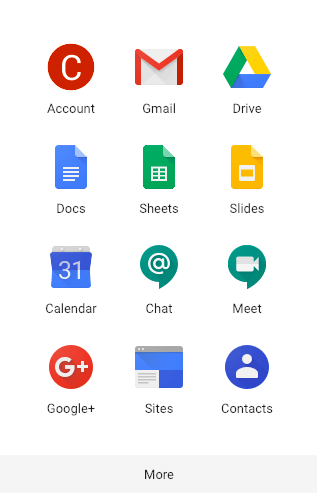
In Google Sheets, the terminology is the same as Excel. To create a google sheet, you click on the nine square image in the top right corner of your Gmail account. Once you are there, you can click on the "Sheets" option or on "Drive" where you can then select "Sheets".
Step 1:

Step 2:
Step 3:
Below are gifs that show how to create a chart in Excel. The following things are covered:


That is it for Google Sheets, as you can see there is little difference between Excel and Google Sheets when it comes to the basics. Most of the time it is just the location of where the functions you need are located in different spots. One benefit of Google Sheets compared to an Excel workbook is the ease of sharing the workbooks with others and working on the same sheet simultaneously as someone else.
The purpose of this tutorial is to help people at the beginner level of spreadsheets understand the options they have to use spreadsheets, the basic terminology, and how to create their first table. As mentioned at the beginning of the tutorial, to expand on these basics take DataCamp's Spreadsheet Basics course and check out our Graphs in Spreadsheets tutorial. Thanks for reading and look for more spreadsheet tutorials to come out on more beginner and advanced topics.
Spreadsheets Courses
Course
cheat-sheet
Richie Cotton
Tutorial
Avinash Navlani
Tutorial
Parul Pandey
Tutorial
Aditya Sharma
Tutorial
Aditya Sharma
Tutorial
Francisco Javier Carrera Arias