Traseu de învățare
Bazele Tableau
4.5+
Învață elementele esențiale ale Tableau și dezvoltă abilitățile de care ai nevoie pentru a promova certificarea Tableau Desktop Specialist. Nu este necesară nicio experiență anterioară!16 recenzii
23 h
sau
Recommended for Tableau beginners
Build your Tableau and data visualization skills with interactive courses, tracks and projects, curated by real-world experts.
Traseu de învățare
Curs
Nu știi de unde să începi?
Fă o evaluareCurs
Curs
Curs
Curs
Curs
Curs
Curs
Curs
Curs
Curs
Curs
Curs
Curs
Curs
Curs
Curs
articol de blog
Jess Ahmet
6 min.
articol de blog
Chloe Lubin
15 min.
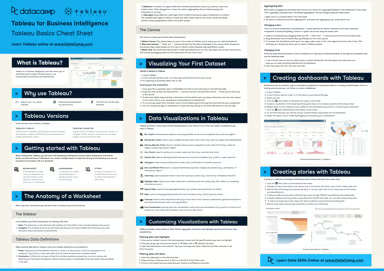
cheat sheet
Richie Cotton
8 min.
Fă progrese din mers cu cursurile noastre mobile și provocările zilnice de programare de 5 minute.