
Course
Understanding ChatGPT
1 hr
411.3K
Gain the skills to maximize Excel—no experience required.
Copilot in Excel is Microsoft’s generative AI assistant built directly into Excel. It helps users speed up the process of analyzing and cleaning data through natural language commands. You can ask it to summarize trends, help you build PivotTables, generate charts, write formulas, or even provide insights directly from your dataset.
Copilot understands the context of your data. This is true if you are working with financial statements, survey results, or large CSV files, and it can suggest relevant insights or formulas based on what’s actually in your worksheet. For instance, if you upload a dataset of monthly sales, Copilot can identify seasonal patterns or calculate growth rates - whatever you need.
And since it works directly inside Excel’s interface, you don’t need to switch between tools or learn new software. Copilot in Excel is a natural extension of what Excel already does best.
Microsoft has rolled out built-in Copilot chat functionality in the core Microsoft 365 apps (Word, Excel, PowerPoint, Outlook, OneNote) for many commercial/enterprise customers — and you no longer always need a separate Copilot add-on license in those apps. That said, availability might depend on your Microsoft 365 plan, deployment timing, and whether the feature has been enabled for your tenant.
Here is how I verified my subscription: I went to the top ribbon and clicked Excel > About Excel.
I could see that Copilot was included: Microsoft 365 Subscription, Copilot for Microsoft 365.

I also knew that Copilot was available because I could see a Copilot icon in the Excel ribbon or near the toolbar at the top of your screen under the Home tab. It's bright and hard to miss.

Let’s test Copilot in Excel along a few dimensions, including its ability to understand and query data and perform calculations and aggregations. To test it out, I’ll use a Kaggle dataset of mathematicians, which you can download for yourself if you want to practice.
My first major test was to see how well Copilot could interpret and retrieve information directly from structured text data. So, using my mathematician's table, which includes columns such as Name, Birthplace, Century, and Contributions, I asked Copilot:
Which mathematician was born in Leuven, Belgium?
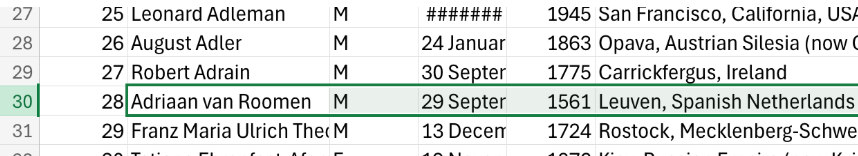
This was a simple question I could’ve answered myself, but I wanted to see how Copilot might handle the nuance. (Our dataset lists part of Belgium under an old name, the Spanish Netherlands, at least for this entry.)
For Copilot, the historical name didn’t present a problem: Copilot correctly identified Adriaan van Roomen as the mathematician born in Belgium. It also even summarized a key detail from the dataset: that he calculated π to 16 decimal places.

This was a good start to my review: Copilot demonstrated one of its strong points: its contextual understanding of data labels and values. I decided to press harder.
Next, I tested Copilot’s ability to perform numerical operations and filtering. Using the same dataset, I requested this:
Count how many mathematicians were born in Belgium.
Now I felt like I was stacking the requests a bit. This time, I was asking Copilot to perform a calculation while keeping in mind that parts of what is now Belgium were labeled in the historical record as the Spanish Netherlands.
Copilot generated the correct total and explained the logic behind its method, which was to apply a filtered count across the Birthplace column. In the interest of being thorough, I did take the extra trouble to recode and sort the dataset and count the rows (old habits die hard), and I can verify that Copilot’s answer was correct.

Generating formulas might be Copilot’s most practical use case, especially since Excel syntax can be tricky and counterintuitive. For example, one would be forgiven for thinking that the AVERAGEIF() function has the same syntax as AVERAGEIFS(), but it doesn’t because the arguments are reversed. If Copilot really offered a promising shortcut and way to avoid mistakes in writing functions, I would be all ears.
To test the accuracy of formula writing, I asked a new question:
Can you write a formula to count the number of mathematicians who were born in China in the 18th or 19th centuries?
Copilot returned a usable Excel formula, which in this case was a COUNTIFS(), that could be directly pasted into a cell. The formula gave the correct answer (five). It correctly interpreted the two conditions (century and birthplace) and referenced the proper ranges. Copilot successfully turned my instructions into valid, executable Excel syntax.

=COUNTIFS(G2:G3169, "China", E2:E3169, ">=1700", E2:E3169, "<=1899")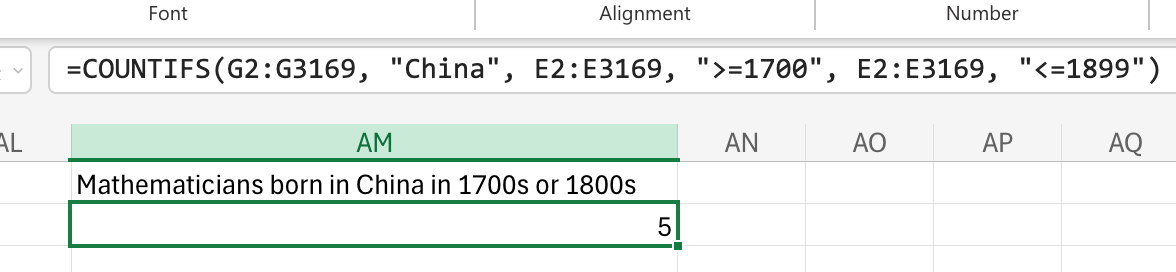
I tried quite a few more formula prompts, including things that involved logical filters using functions like AND() combined with SEARCH(), as one example, and XLOOKUP() combined with IFERROR() as another. I also tried asking Copilot to put LEFT(), FIND(), and MID() together to reformat data, as we did in our Excel Substring() article. In every case, Copilot did a good job.
These examples taken together really showed me that Copilot isn’t limited to surface-level automation, and that it really is able to bridge the gap between those kinds of Excel users who understand what they want to calculate with those other users who already know how to write formulas in Excel.
For my next test, I wanted to try Copilot in Excel to help me find formulas that I would use to clean up and change the actual dataset. At issue were inconsistencies in the place names.
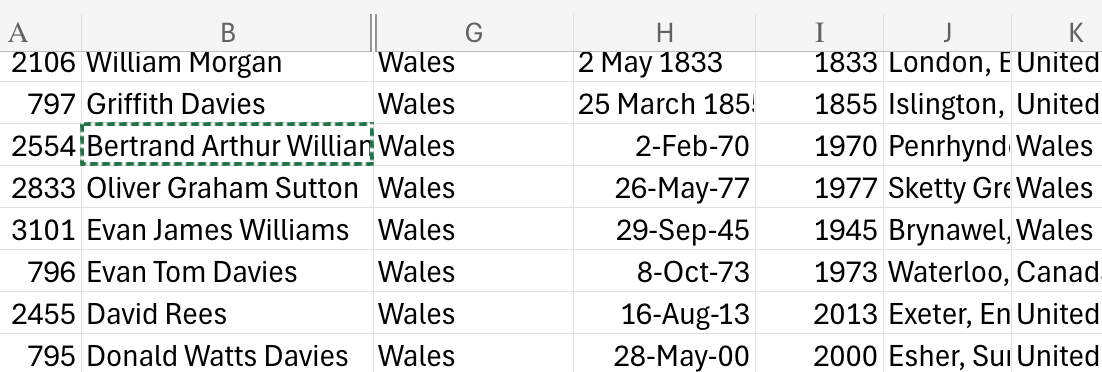
For example, I noticed that Bertrand Russell was listed as having been born in Wales in a village called Trellech. But this was in the 19th century, after Wales had been considered a part of the UK. Other mathematicians from the same time were listed as having been born in the UK more generally. It was as if the dataset interpreted “born in the UK” to mean “born in the UK except for Wales.” This was confusing.
I tested to see if Copilot could help put my data on the same level:
Give me the formula where I can create a new column next to born_country called standardized_country. I want to standardize the place names in born_country so they’re all at the same level — for example, I will convert regions or parts of countries (like ‘Wales’) to the broader country name (‘United Kingdom’) for consistency.
Copilot gave me back a working formula using SWITCH(). I got a good result, and I was impressed.
=SWITCH(A2,"Wales","United Kingdom","Scotland","United Kingdom","England","United Kingdom","Northern Ireland","United Kingdom",A2)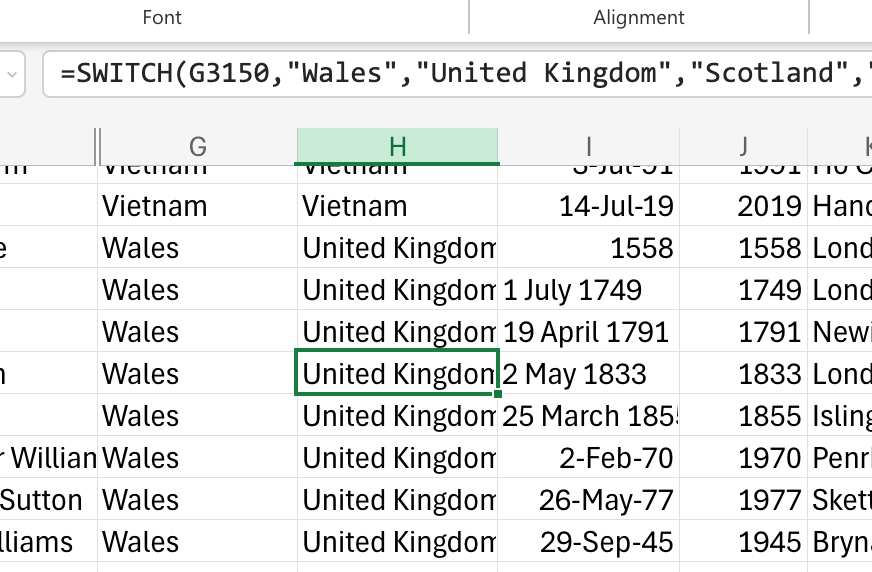
For my final test, I asked Copilot to generate insights from the data that could inform new forms of analysis. Copilot gave me some very cool ideas about what I could do:
It told me about female representation over time:
A time-series analysis could show an increase in female representation beginning in the 20th century, coinciding with broader social reforms and higher education access.
It gave me some thoughts on migration patterns:
Many mathematicians were born in one country and died in another, offering a view of intellectual migration — for example, European scholars moving to the U.S. in the 20th century.
It gave me ideas on mathematical influences through advisor networks or specific schools of thought:
Map advisor–student networks to visualize academic lineages. Analyze the expansion of mathematical schools of thought (e.g., topology, algebra, logic) using the classification indices.
After working through the dataset and pushing Copilot with more requests, I came to believe that Copilot’s limitations were most visible in edge cases and also in longer workflows:
I tried different versions of the above prompts, fiddling with the level of detail and other issues, so I can verify that these ideas do make a difference.
And remember, Copilot is not a replacement for spreadsheet literacy. Data analysts still need to validate outputs. In my case, I think Copilot handled my questions with remarkable competence, but it's always worth double-checking your numbers.
If you’re an Excel user and you’re worried about the AI revolution, fear not. You won’t get left behind. Excel isn’t going away. It’s only getting better, and it's more worth learning than ever.
I think it really is a real step forward in how AI integrates with the everyday work of analysts. I had consistently good results in my own review, but - as a word of caution - I have seen others struggle. Some of this might come down to better or worse prompting skills. You can take our Understanding Prompt Engineering course to keep improving your prompting. Also, try our Introduction to Microsoft Copilot course and our Data Analysis in Excel course to learn in-demand data skills and enhance your productivity.
Learn with DataCamp
Course
Course
Course
blog
Josef Waples
11 min
Tutorial
Laiba Siddiqui
Tutorial
Laiba Siddiqui
Tutorial
Laiba Siddiqui
Tutorial
Eugenia Anello
code-along
Nuno Rocha